Containment Period Review
I’ve already shown you our measurement of distance between people based on the images captured by our cameras. We can now derive an average daily behaviour for the entire containment period:


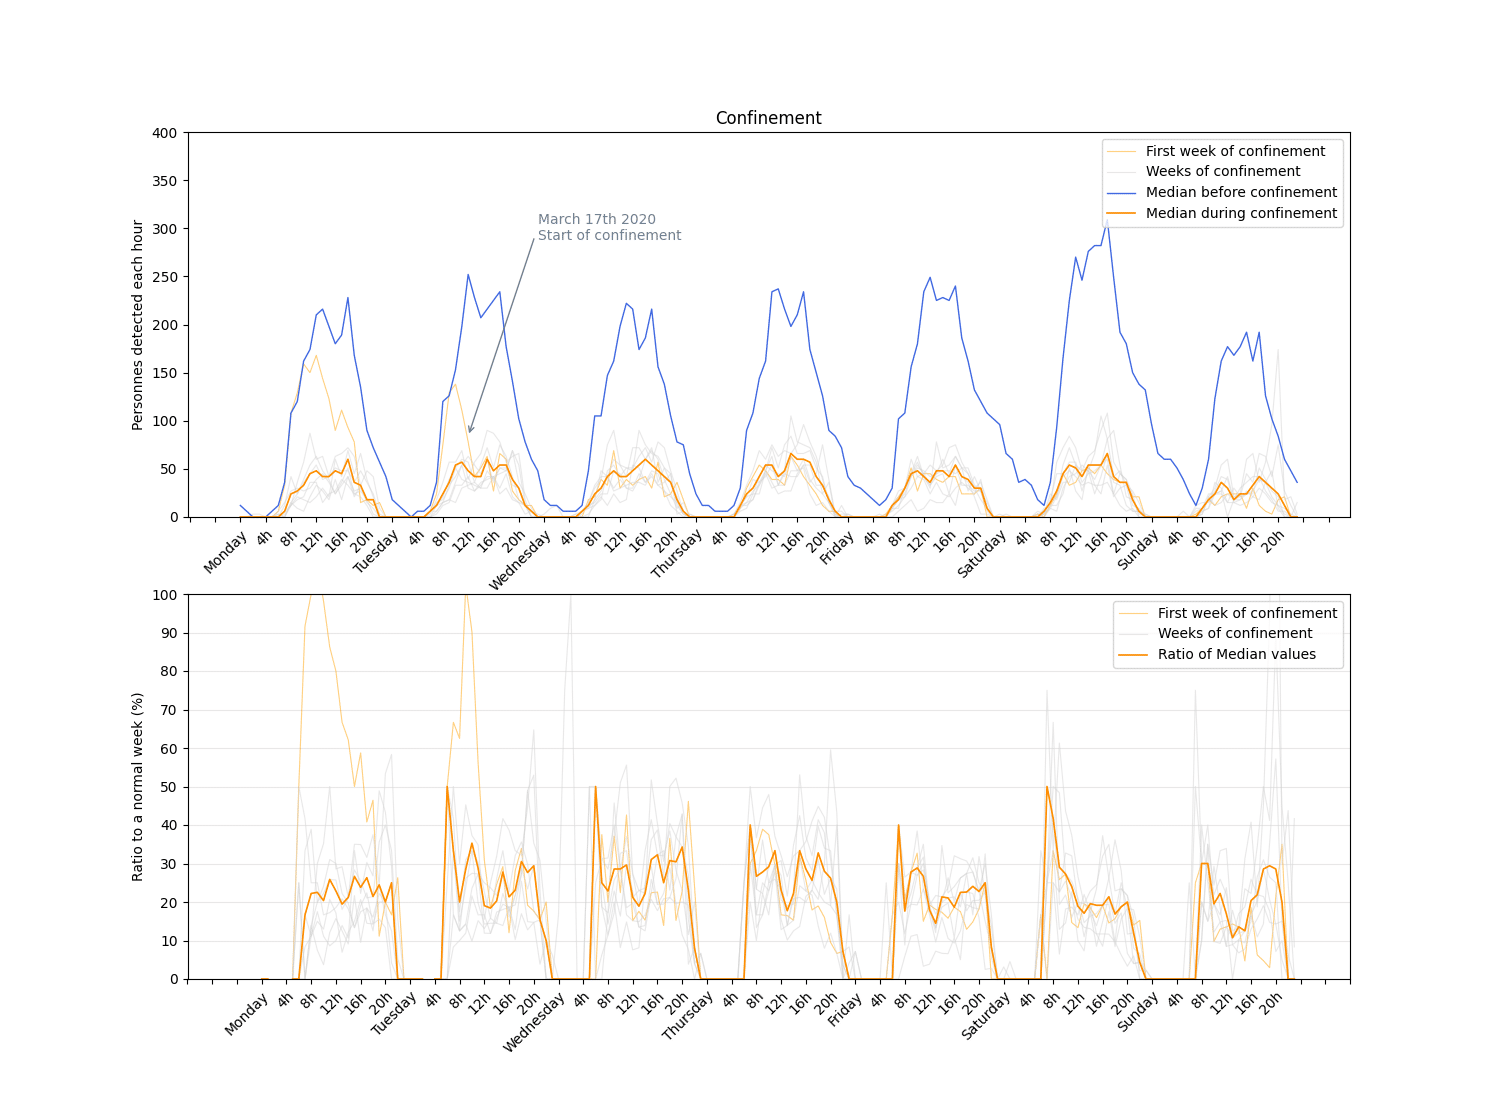
The number of people on the street during confinement is therefore divided by a factor of 4 or 5 depending on the day. And we also observed a division by a factor of up to 10 of the number of cases of people within one metre.
But what’s interesting to see is the evolution of this metric over time. Has containment been respected in the same way over the last two months?
Evolution of the metrics over time

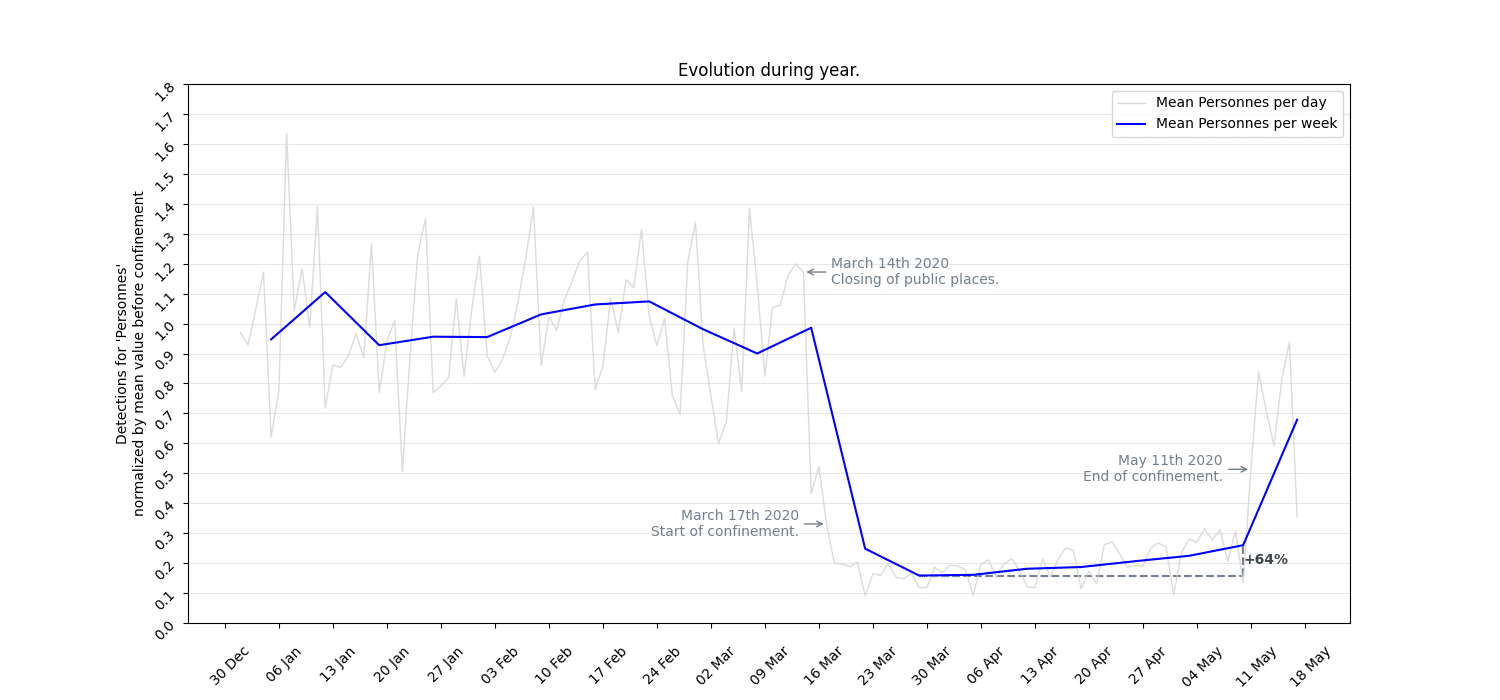

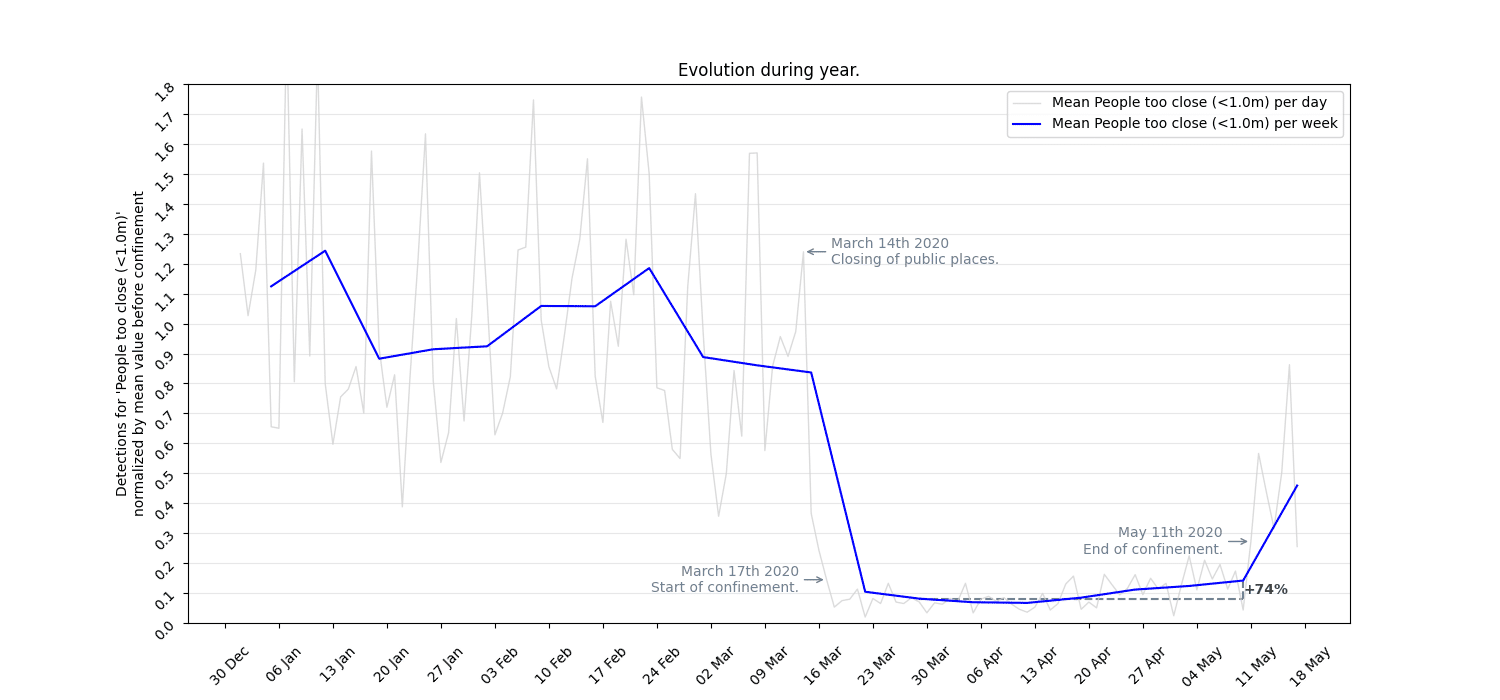
And since May 11th it is obvious that we are heading towards a return to normal?
Post-confinement

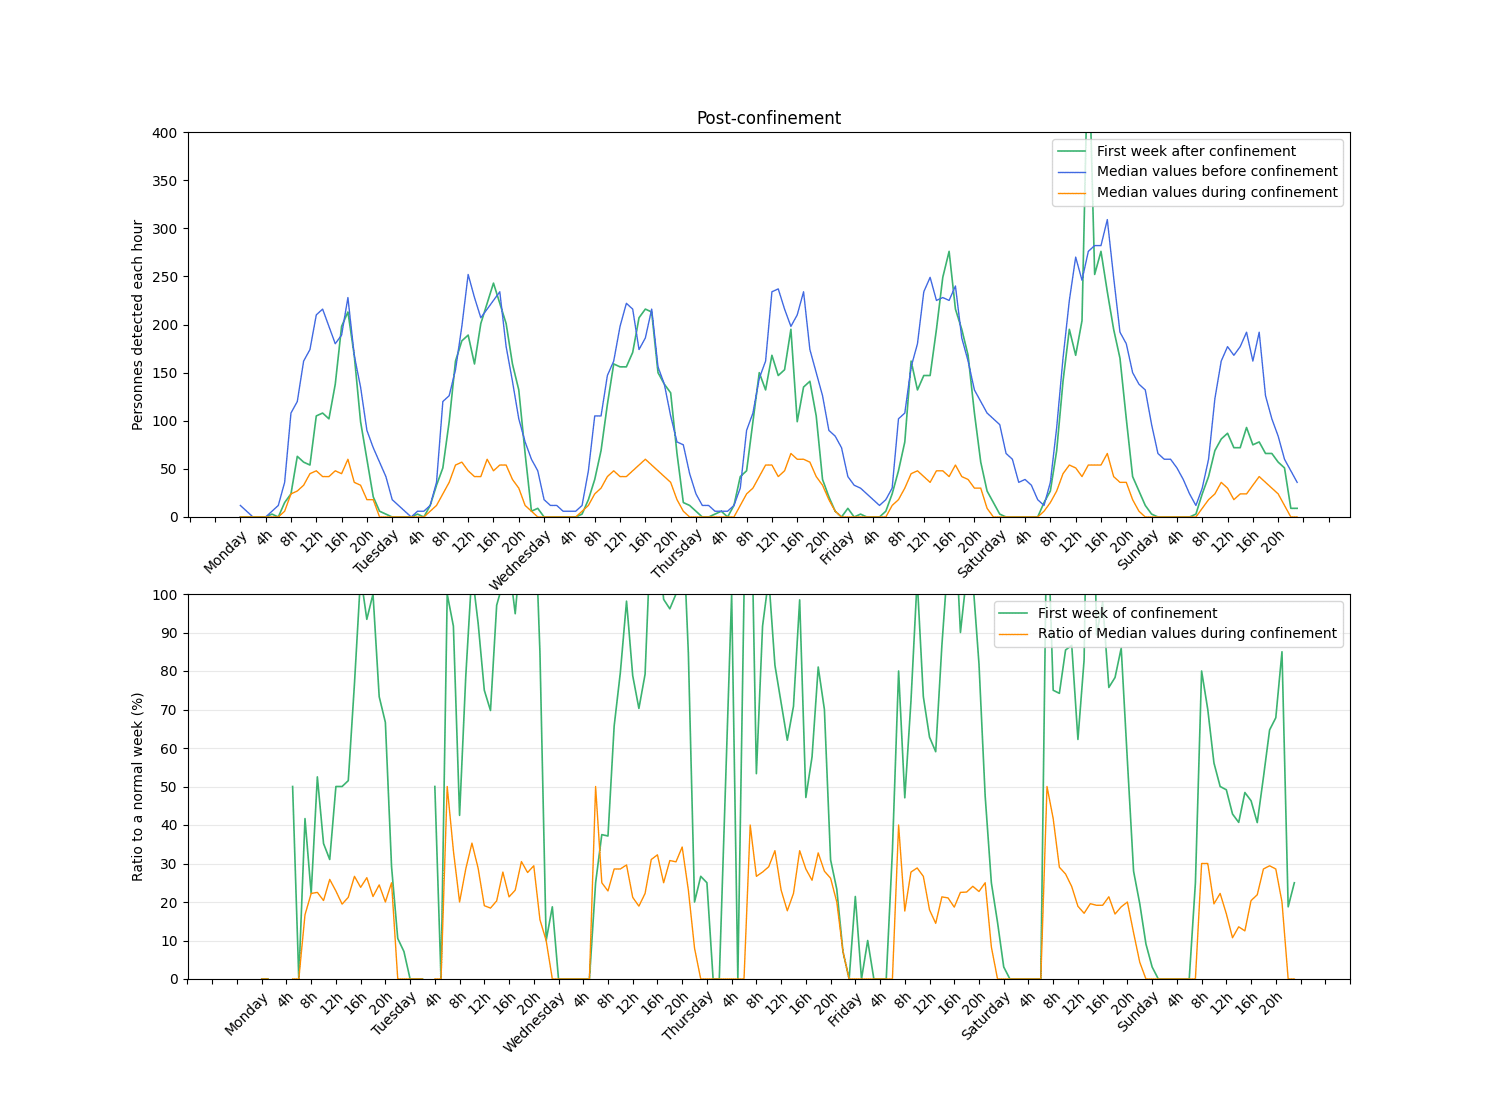

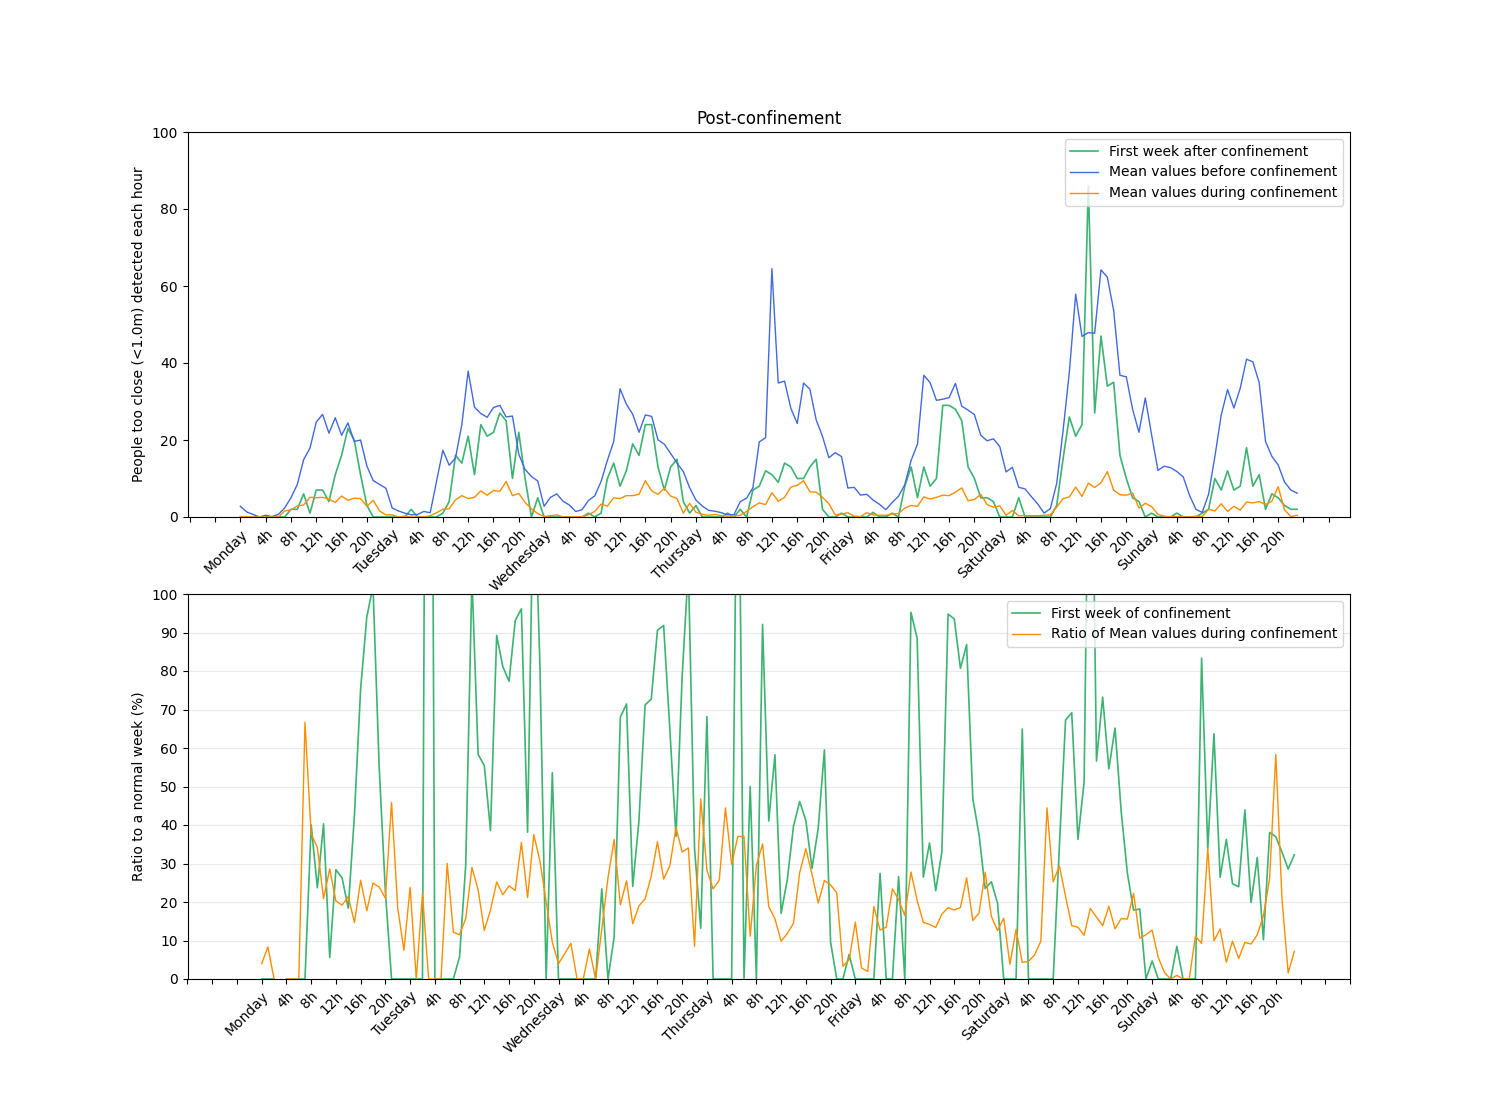
We will continue to monitor these measures in the coming weeks.
Conclusions
It is interesting to see that with only 6 photos per hour, for which it is impossible to identify or track individuals, it is very easy to identify trends and objective measures.
This very particular period of generalized confinement could be observed in very different ways (reduction of greenhouse gases, reduction of seismic noise, runaway prices of certain commodities on Amazon, …) and I was the first to be surprised to see the “live” impact on our images. As the camera in question was installed shortly before the crisis, we had all the data we needed to study its impact.
This should remind us that sometimes we have to take the time to observe things over the long term, and we often learn something valuable from it. And you’re never safe from a surprise that you can then document.
Written by Adrien Fontvielle – R&D leader – Camera systems and image processing at Enlaps
Containment: assessment of the observations of our camera “to understand the city” and return to normal for pedestrian traffic in the city.


